
پرونده:Economics Gini coefficient2.svg

حجم پیشنمایش PNG این SVG file:۵۰۰ × ۵۰۰ پیکسل کیفیتهای دیگر: ۲۴۰ × ۲۴۰ پیکسل | ۴۸۰ × ۴۸۰ پیکسل | ۷۶۸ × ۷۶۸ پیکسل | ۱٬۰۲۴ × ۱٬۰۲۴ پیکسل | ۲٬۰۴۸ × ۲٬۰۴۸ پیکسل.
پروندهٔ اصلی (پروندهٔ اسویجی، با ابعاد ۵۰۰ × ۵۰۰ پیکسل، اندازهٔ پرونده: ۲ کیلوبایت)
این پرونده در ویکیانبار موجود است. محتویات صفحهٔ توصیف آن در زیر نمایش داده میشود. |
خلاصه
| توضیح |
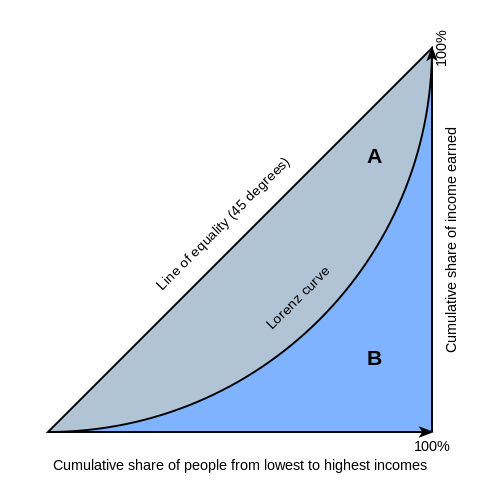
English: Gini coefficient diagram, based on the version by Bluemoose/BenFrantzDale. You can think of the horizontal axis as percent of people and the vertical axis as the percent of income those people receive. Therefore the Lorenz curves always start and end at the same places, where 0% of people make 0% of the country's income and 100% of people make 100% of the total income.
Inequality is implied when the curve is below the 45-degree line: At the left, the percentage of people is higher than the percent of income they receive (i.e. 10% of the people getting 5% of the total income); at the right, the percent of income received rises more than the percent of people receiving it. The area above the Lorenz curve -- marked "A" -- is shaded differently from the area below the curve -- marked "B". This simplifies the mathematical explanation of the gini coefficient, which is A/(A+B) |
| تاریخ | |
| منبع | The original file was on WikiMedia Commons (http://en.wikipedia.org/wiki/File:Economics_Gini_coefficient.svg). I have edited the file. |
| پدیدآور | Reidpath |
| دیگر نسخهها | آثار انشقاقی از این پرونده: Economics Gini coefficient2-ar.svg |
اجازهنامه
این تصویر از متن فاقد شرایط لازم برای حق تکثیر است و بنابراین در مالکیت عمومی قرار دارد، به این دلیل که شامل اطلاعاتی است که به صورت مشترک بدون خلاقیت کافی مؤلف آن هستند. حقایق، دادهها و اطلاعات غیر اصل در خط تایپ عمومی یا دست خط ساده و اشکال سادهٔ هندسی با حق تکثیر محافظت نمیشوند.
توجه: این الگو به طور عمومی به عکس نثر یا سایر متنهای خلاقانه که به اندازهٔ کافی بلند هستند که واجد شرایط حق تکثیر باشند، بکار نمیرود.
|
تاریخچهٔ پرونده
روی تاریخ/زمانها کلیک کنید تا نسخهٔ مربوط به آن هنگام را ببینید.
| تاریخ/زمان | بندانگشتی | ابعاد | کاربر | توضیح | |
|---|---|---|---|---|---|
| کنونی | ۶ مارس ۲۰۲۱، ساعت ۱۸:۰۰ | | ۵۰۰ در ۵۰۰ (۲ کیلوبایت) | Nyq | decapitalized common nouns |
| ۲۰ مارس ۲۰۱۶، ساعت ۱۶:۵۲ |  | ۵۰۰ در ۵۰۰ (۲ کیلوبایت) | Wylve | Fixed CSS | |
| ۲۰ مارس ۲۰۱۶، ساعت ۱۶:۵۱ |  | ۵۰۰ در ۵۰۰ (۲ کیلوبایت) | Wylve | Reduce tracing artifacts | |
| ۲۴ ژوئن ۲۰۰۹، ساعت ۱۵:۱۸ |  | ۵۰۰ در ۵۰۰ (۷ کیلوبایت) | Reidpath | {{Information |Description={{en|1=Gini coefficient diagram, based on the version by Bluemoose/BenFrantzDale. You can think of the horizontal axis as percent of people and the vertical axis as the percent of income those people receive. Therefore the Loren |
کاربرد پرونده
صفحههای زیر از این تصویر استفاده میکنند:
کاربرد سراسری پرونده
ویکیهای دیگر زیر از این پرونده استفاده میکنند:
- کاربرد در af.wikipedia.org
- کاربرد در ar.wikipedia.org
- کاربرد در bh.wikipedia.org
- کاربرد در bn.wikipedia.org
- کاربرد در en.wikipedia.org
- Gini coefficient
- Lorenz curve
- Poverty
- Portal:Mathematics/Featured picture archive
- Wikipedia:Reference desk/Archives/Humanities/2010 December 18
- Portal:Mathematics/Featured picture/2012 08
- Wikipedia:Village pump (technical)/Archive 106
- Portal:Mathematics/Selected picture
- Portal:Mathematics/Selected picture/11
- User:Lexsta/sandbox
- کاربرد در et.wikipedia.org
- کاربرد در he.wikipedia.org
- کاربرد در it.wikipedia.org
- کاربرد در ja.wikipedia.org
- کاربرد در km.wikipedia.org
- کاربرد در la.wikipedia.org
- کاربرد در ms.wikipedia.org
- کاربرد در nl.wikipedia.org
- کاربرد در ro.wikipedia.org
- کاربرد در si.wikipedia.org
- کاربرد در sq.wikipedia.org
- کاربرد در sr.wikipedia.org
- کاربرد در te.wikipedia.org
- کاربرد در ur.wikipedia.org